
When it comes to organizing data, performing calculations, or building reports, Microsoft Excel is one of the most powerful and widely used tools. Whether you’re a student, job seeker, or working professional, learning Excel basics can significantly boost your productivity.
Let’s break it down step by step so you can get started with confidence.
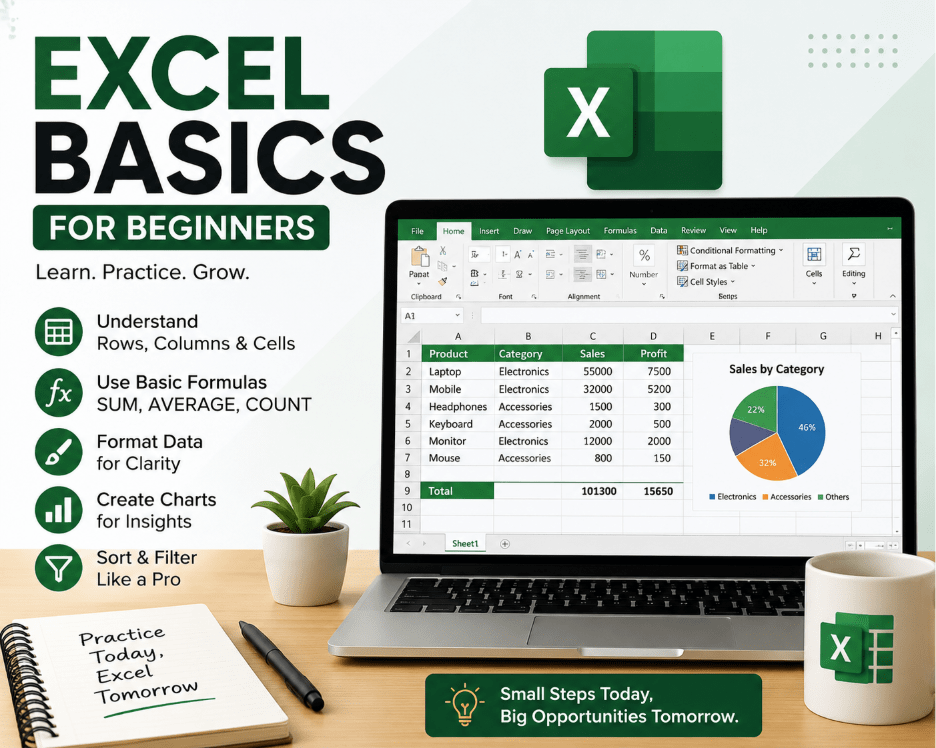
🧾 What is Excel?
Excel is a spreadsheet application that allows you to store, organize, and analyze data in a tabular format (rows and columns). It’s widely used for:
- Data entry and management
- Calculations and formulas
- Charts and dashboards
- Financial analysis
🏗️ Understanding the Excel Interface
When you open Excel, you’ll see several key components:
- Workbook → The entire Excel file
- Worksheet (Sheet) → Individual tabs inside a workbook
- Rows → Numbered horizontally (1, 2, 3…)
- Columns → Lettered vertically (A, B, C…)
- Cell → Intersection of row & column (e.g., A1)
- Formula Bar → Where you write or edit formulas
✍️ Basic Data Entry
Entering data in Excel is simple:
- Click on a cell
- Type your data (text, numbers, or dates)
- Press Enter
Example:
| Name | Age | Score |
| Ram | 22 | 85 |
| Sita | 21 | 90 |
🧮 Basic Formulas You Must Know
Formulas are the heart of Excel. They always start with =.
Common formulas:
- =SUM(A1:A5) → Adds numbers
- =AVERAGE(A1:A5) → Calculates average
- =COUNT(A1:A5) → Counts numeric values
- =MAX(A1:A5) → Finds highest value
- =MIN(A1:A5) → Finds lowest value
👉 Example:
=SUM(B2:B4) → Adds values in cells B2 to B4
🎨 Formatting Your Data
Make your data look clean and professional:
- Bold/Italic for headings
- Cell colors for highlighting
- Borders for tables
- Number formatting (currency, percentage, date)
📊 Creating Charts
Excel makes data visualization easy.
Steps:
- Select your data
- Go to Insert tab
- Choose chart type (Bar, Pie, Line)
Charts help you quickly understand trends and insights.
🔍 Sorting and Filtering
To manage large data:
Sorting:
- Arrange data in ascending or descending order
Filtering:
- Show only specific data (e.g., scores > 80)
Go to Data → Sort/Filter
💡 Useful Tips for Beginners
- Use Ctrl + S frequently to save
- Learn keyboard shortcuts (Ctrl + C, Ctrl + V)
- Use AutoFill to quickly copy patterns
- Keep your data clean and structured
🚀 Why Learn Excel?
Excel is a must-have skill for many careers:
- Data Analyst
- Accountant
- Business Analyst
- Project Manager
Even basic knowledge can help you in daily tasks and job opportunities.
🏁 Conclusion
Getting started with Excel might feel overwhelming at first, but once you understand the basics—data entry, formulas, and formatting—you’ll realize how powerful it is.
Start practicing with small datasets, explore features gradually, and soon you’ll be confident using Excel like a pro.